Year/Year Total Casino Gaming Revenue — July
| Month/Year | Revenue | Change |
|---|---|---|
| July 2025 | $165,661,894 | |
| July 2024 | $169,821,310 |
Includes July casino gaming revenue for years noted.
Fiscal Year to Date: Total Casino Gaming Revenue
| Fiscal Year | Revenue | Change |
|---|---|---|
| FY 2025 | $165,661,894 | |
| FY 2024 | $169,821,310 |
Includes casino gaming revenue for fiscal years noted. The fiscal year runs from July 1 through June 30.
Monthly Revenue Reports
To view a detailed breakdown of fund disbursement, fiscal year-to-date totals for the individual casinos and the combined state cumulative total, click on any of the links below.
Cumulative Casino Gaming Revenue Since Inception
$19,965,525,562
| Institution | Total |
|---|---|
| Maryland Education Trust Fund | $6,459,778,840 |
| Casino Operators | $11,225,383,751 |
| Horse Racing | $963,106,831 |
| Local Support | $993,891,868 |
| Maryland Lottery and Gaming | $154,262,041 |
| Small, Minority and Women-Owned Business/Commerce | $153,765,213 |
| General Fund | $15,337,018 |
Totals include casino gaming revenue from September 2010 through July 2025.
Cumulative Problem Gambling Fund Contributions
$56,421,748
Total is from FY2011 through FY2025. Each casino pays an annual assessment of $425 per slot machine and $500 per table game to the Problem Gambling Fund.
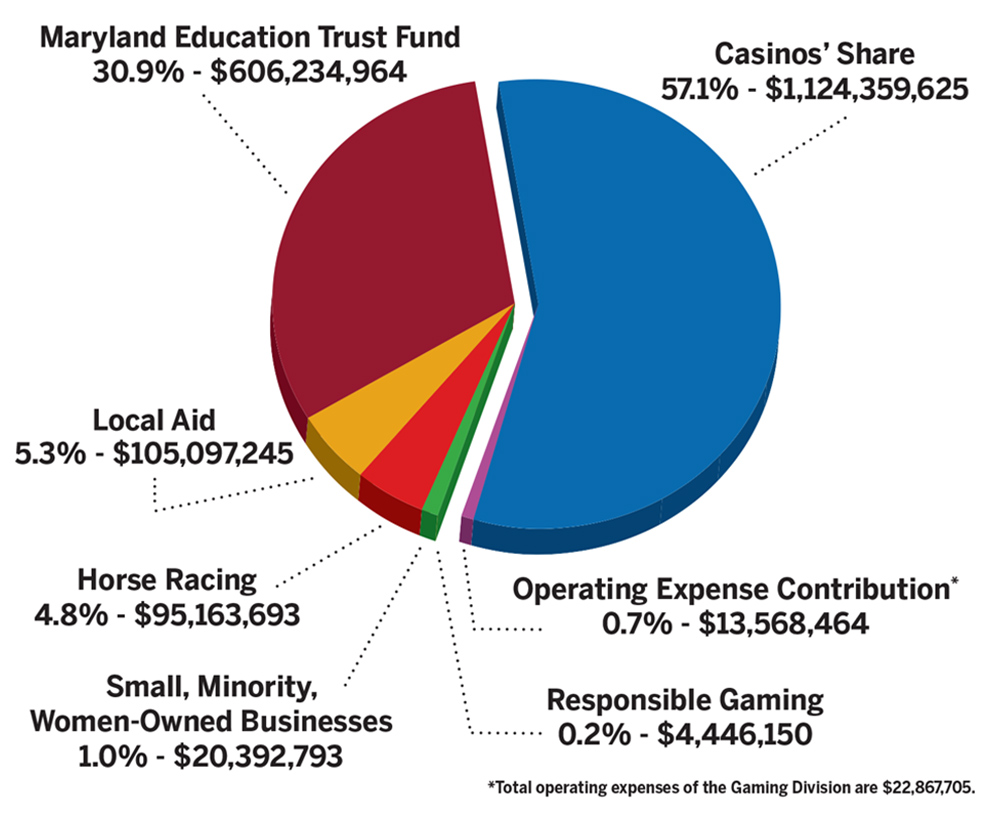
FY 2025 Casino Revenue Distribution

